Results Portal
Dive into the data: Explore our 12 prototypes and results across 5 key domains
From pixels to insights: unleash the power of EvoLand’s results
The EvoLand Results Portal allows you to visualise and interactively explore the 12 prototypes across our 5 key domains (Forest, Agriculture, Water, Urban and General Land Cover).
Integrated as a configuration with Copernicus Browser, you can not only visualise the data but also make use of all the analysis features the Browser offers. Explore, for example, the location in 3D, draw and statistically analyse an area or point of interest (AOI/POI), create beautiful time-lapse animations, and download the raw data or the visualisation as an image.
How to Visualise a Prototype?
To visualise a prototype, make sure the EvoLand configuration is selected in the Configurations dropdown. If you can’t find the EvoLand configuration, take a look at our FAQs. You can then select the prototype of your choice.
To learn more about a prototype, click the small info button next to each one. To visualise the data:
- Click on one of the footprints on the map and then click “Show latest date”,
- Or zoom to one of the available locations and click the “Show latest date” button in the sidebar.
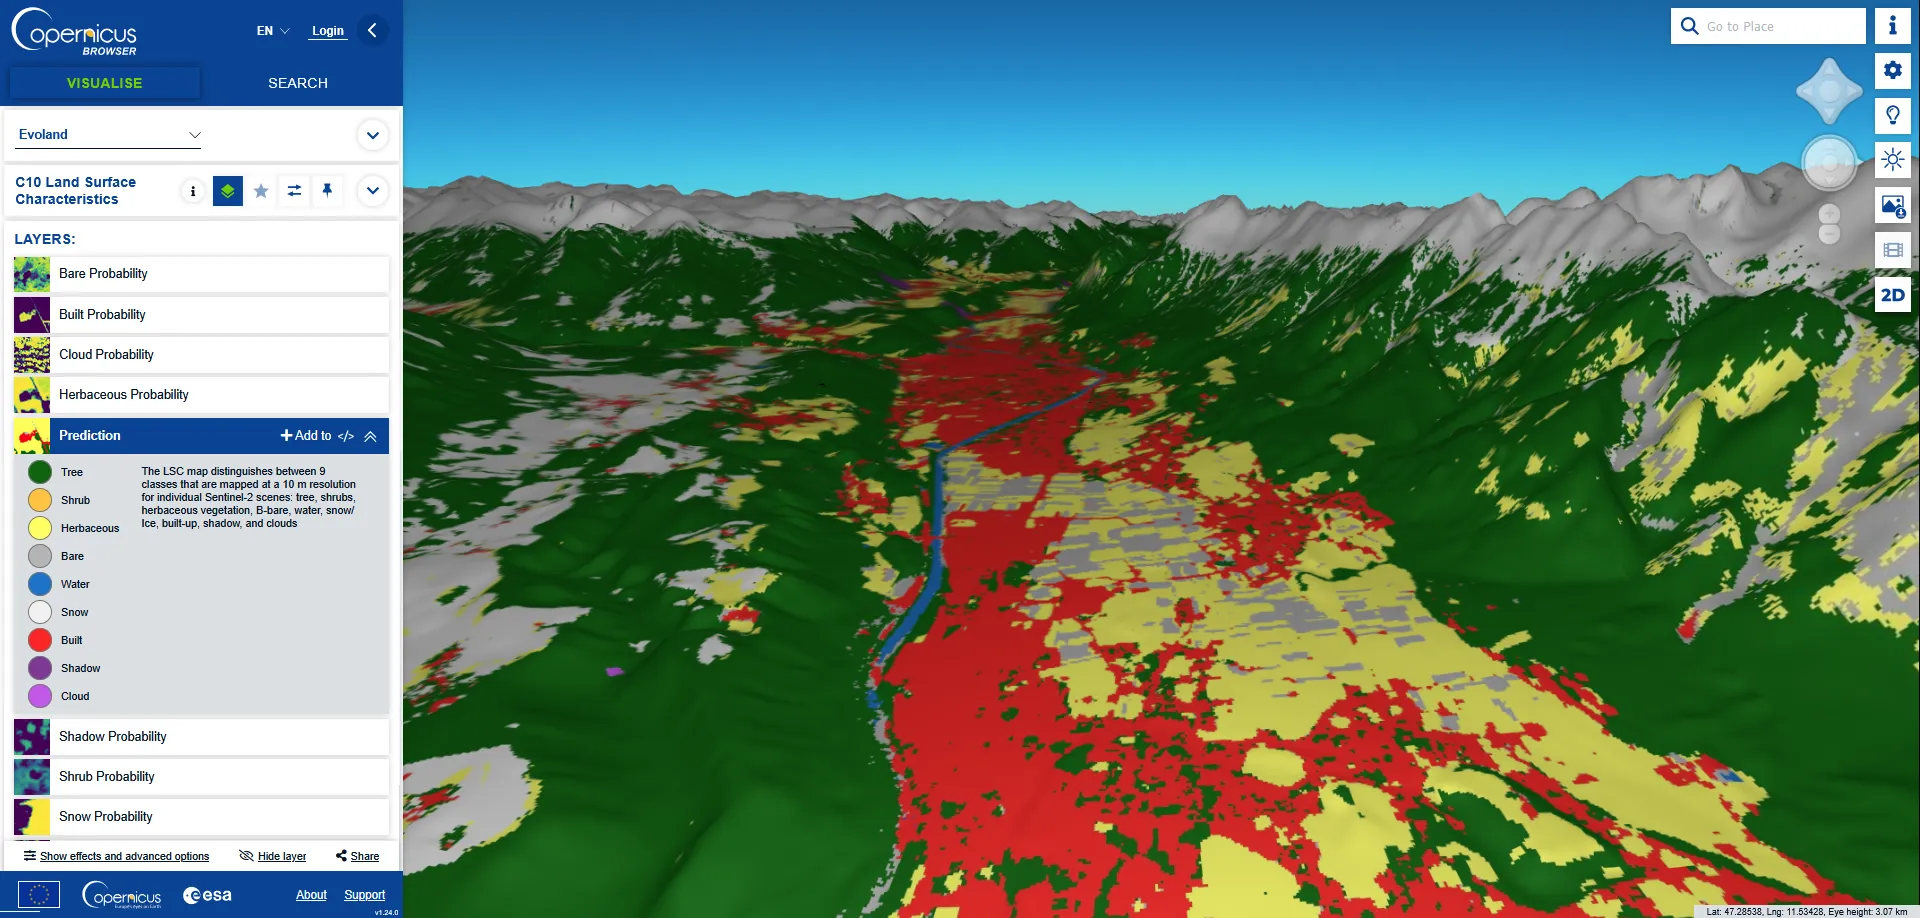
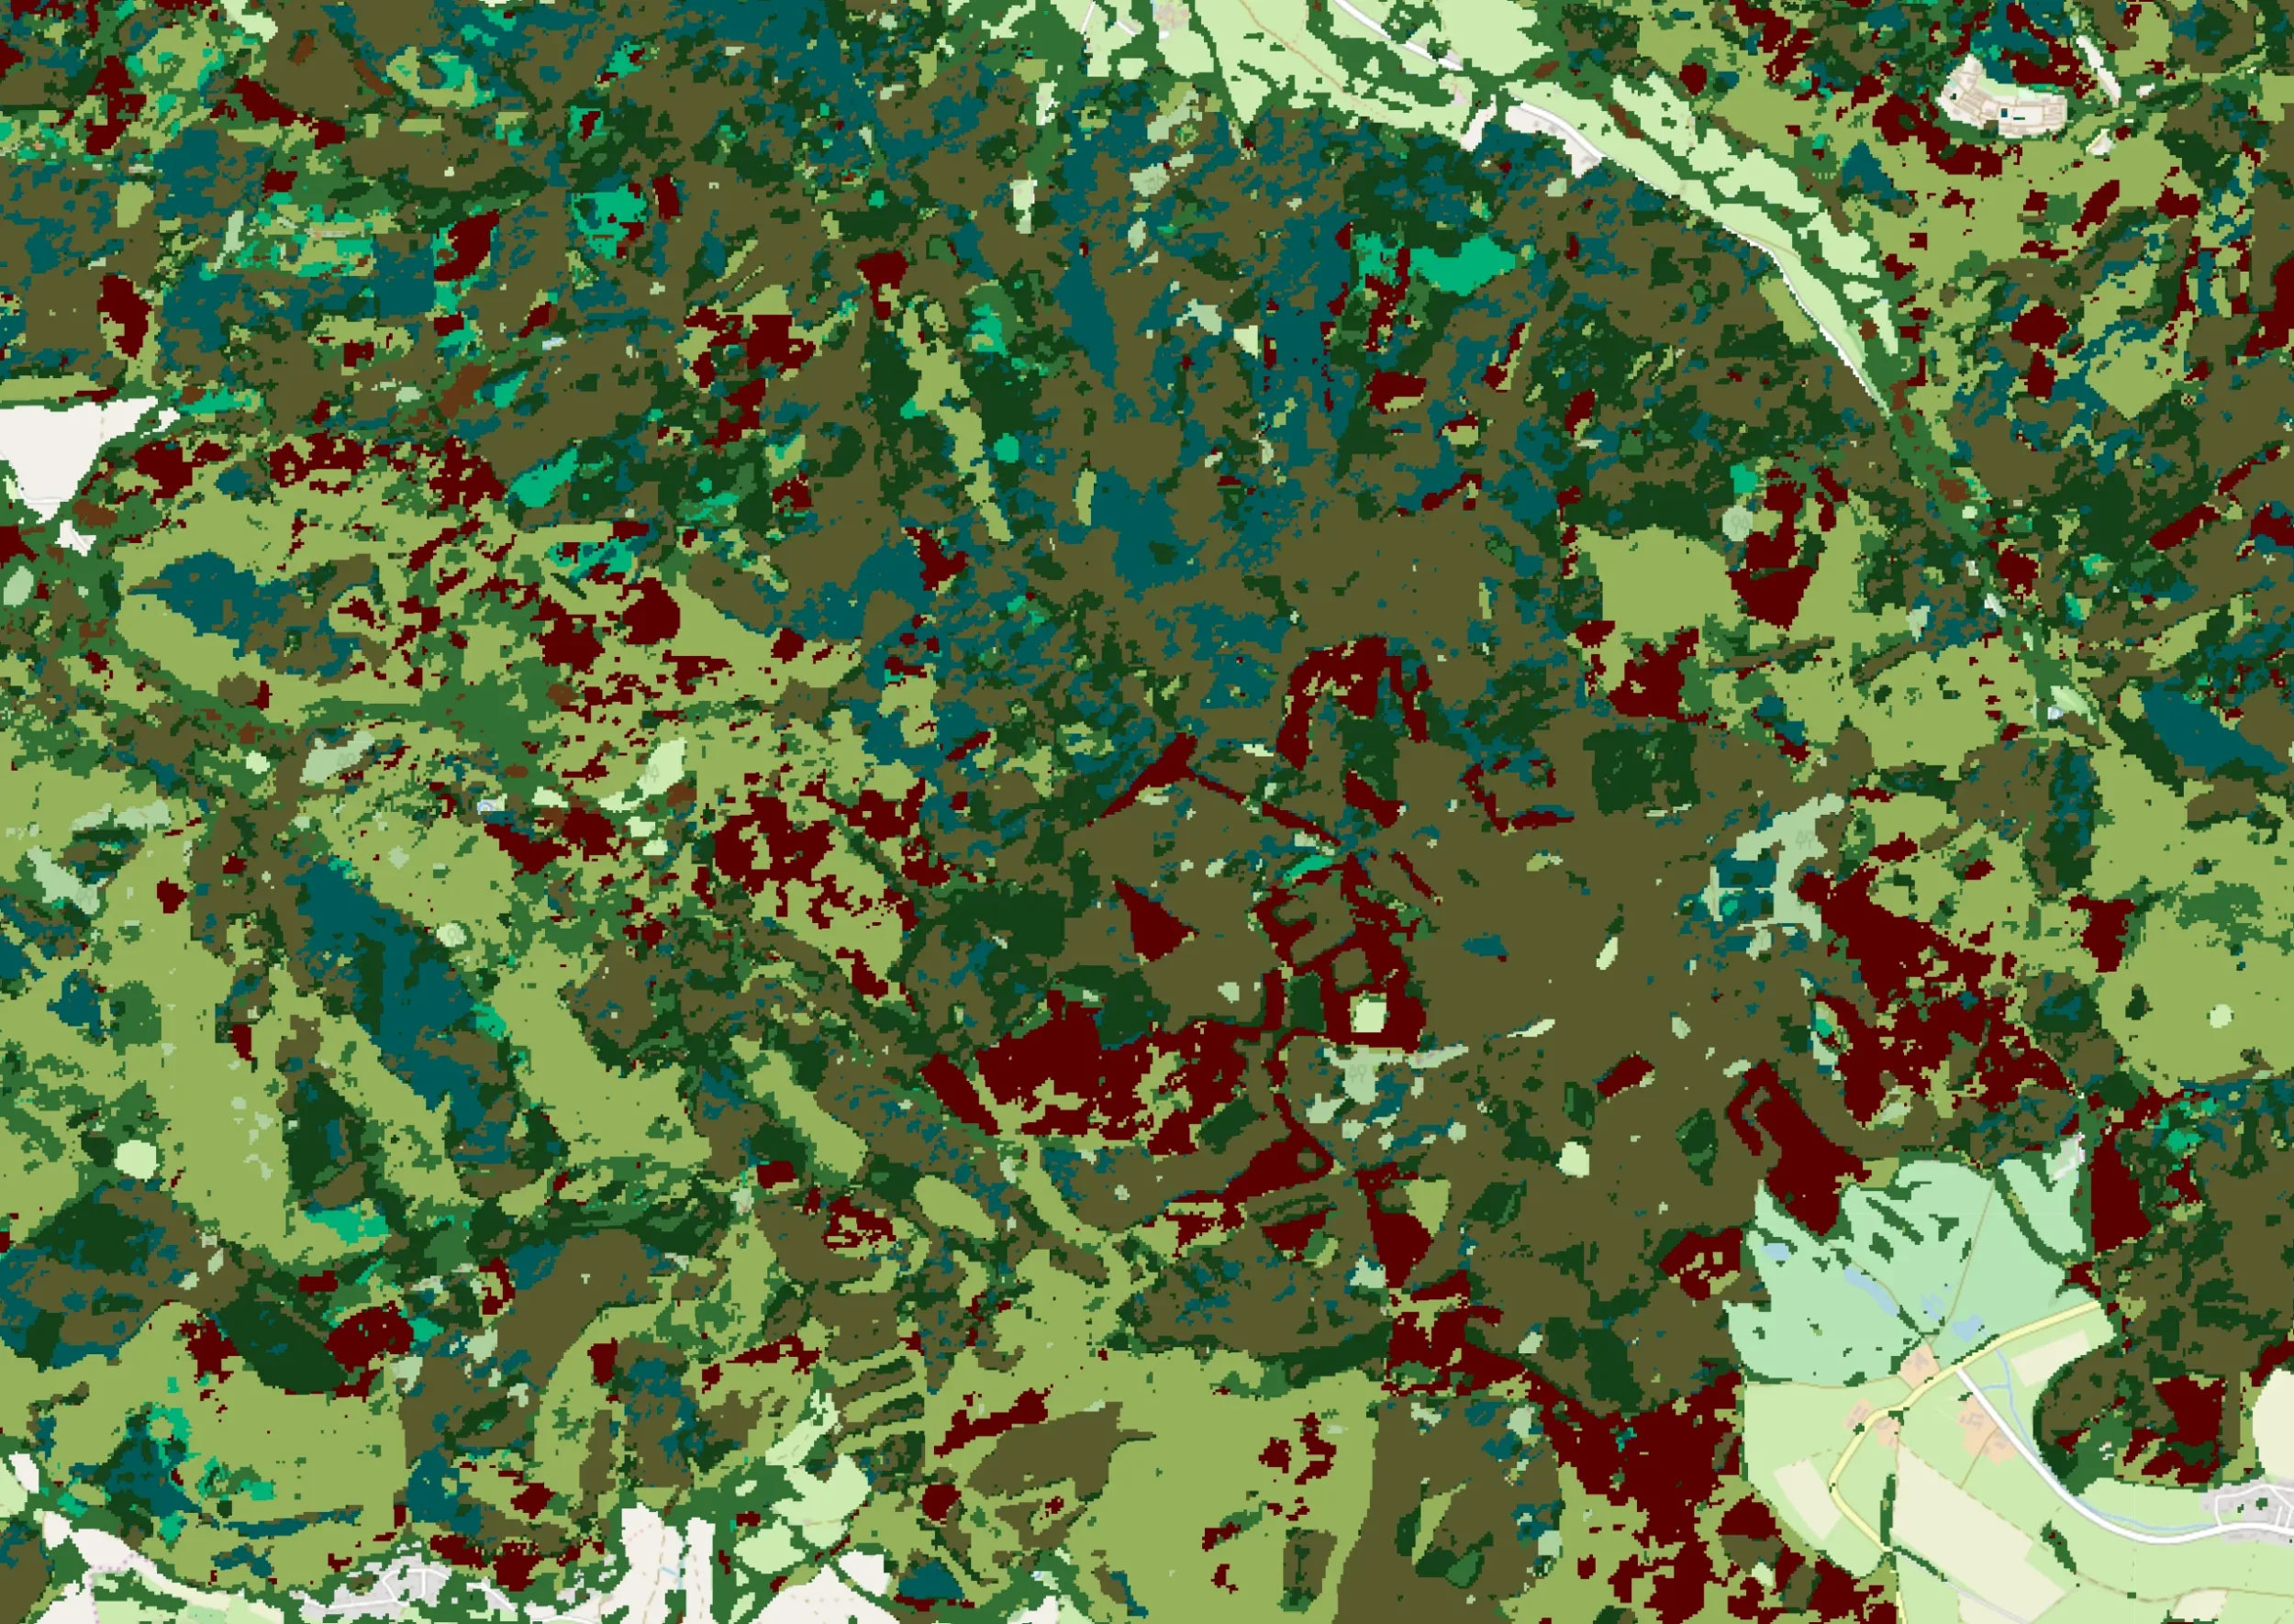
C10 Land Surface Characteristics prediction visualization in 3D mode over Innsbruck: link.dataspace.copernicus.eu/q8pb
As soon as the data are visible on the map, you can learn more about the visualisation by extending the layer description. Switch between different visualisation layers in the sidebar or use the date picker to visualise data for different times. On the right side, you will see different features that let you interact with and analyse the data more deeply.
To perform a statistical analysis, draw an Area of Interest and utilise the statistical feature. Once satisfied with the visualisation, you have the option to download or share it. You may select from various data formats and choose to enable or disable different map overlays (labels, legends, descriptions).
A quick walkthrough of the EvoLand Results Portal
Explore the General User Tutorial to learn everything there is to know about additional features.
Why did we choose to integrate our results in Copernicus Browser?
Why did we choose to integrate our results in the Copernicus Browser? As already hinted in our blog post, utilising an existing solution rather than developing a completely new viewer brought many advantages.
Using the existing solution, we knew we would get a scalable and performant Browser that is already known to the Earth Observation community. It also allowed us to be faster, and thus we had more time to focus on prototype development and data validation, resulting in overall better results.
Lastly, and probably the biggest benefit, was that we not only got a viewer to show our results but also all the visualisation and analysis capabilities already available in the Browser off the shelf.
Head over to the EvoLand Results Portal and start exploring the prototypes today!
Explore results per prototype in the Results Portal
Discover the full range of EvoLand prototypes in one place
C9 – Automated land use mapping of urban dynamics
C10 – Continuous mapping of land surface categories
Frequently Asked Questions
Got questions about the Results Portal? Find quick answers and learn everything you need to know.
Newsletter
Stay current! Subscribe to our EvoLand newsletter!