From space observations to biomass mapping: the EvoLand approach
25 Sep 2025
Biomass in Forests
The cornerstone of this work was the integration of GEDI (Global Ecosystem Dynamics Investigation) lidar, which provides detailed vertical profiles of forest canopies. GEDI’s waveforms capture not only canopy height but also the density and structure of vegetation, serving as a calibration anchor for models based on Sentinel-1 radar, and Sentinel-2 optical imagery. EvoLand developed both Random Forest regressions and deep learning approaches, such as UNet, to translate these multi-sensor signals into spatially continuous maps of above-ground biomass density (AGBD) and forest canopy height.
The results were robust in areas with forests characterized by low AGBD, such as in boreal forests. By grounding the models with lidar or in-situ data, the estimates of canopy height and biomass became more reliable than when relying on radar and optical data alone.
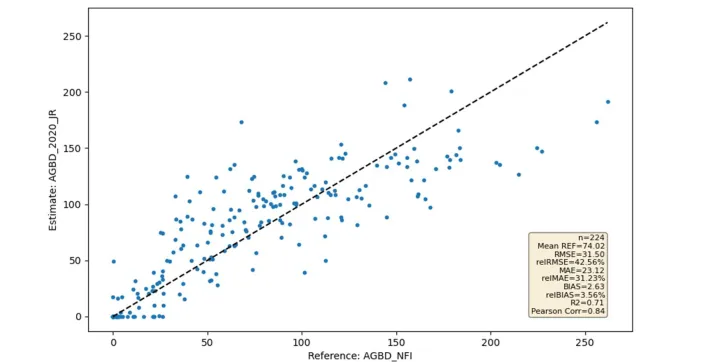
Validation of Above-Ground Biomass Density estimates for the Sweden demonstration site (year 2020) against plot-based field measurements from the Swedish National Forest Inventory.
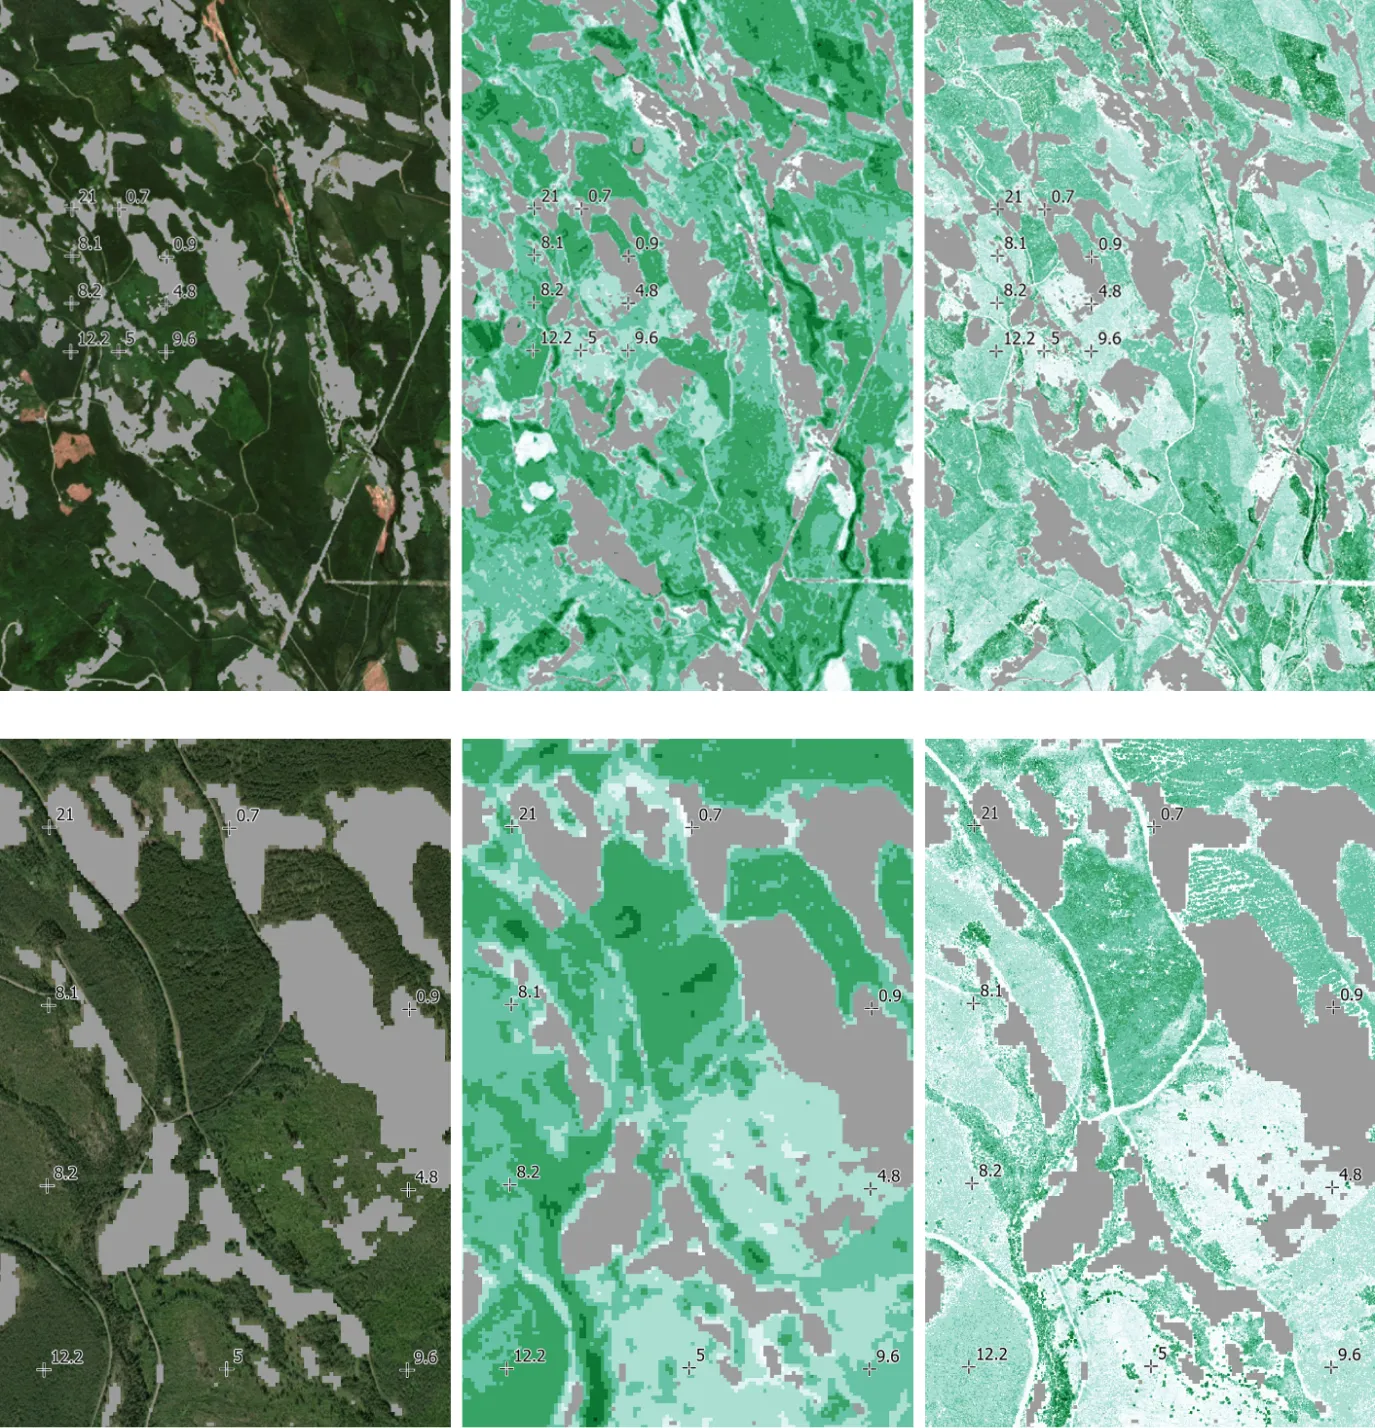
Detailed zoom-in of the Forest Canopy Height estimation for the test site in Sweden. Crosses and labels indicate NFI Sweden reference points. The left column shows Sentinel-2 imagery (top) and very high resolution imagery (bottom). The center column displays satellite-based canopy height estimates, while the right column presents airborne LiDAR data for comparison.
However, for forests with high AGBD, the information content of Sentinel 1 and Sentinel-2 is insufficient due to the well-known saturation effect, where the signal plateaus and loses sensitivity at higher biomass levels. To enable a future pan-European rollout, integrating complementary data sources is therefore essential – particularly SAR L-Band (from the recently launched NISAR or the future ROSE-L mission) and, for tropical forests, SAR P-Band (from the recently launched BIOMASS satellite).
Biomass in Croplands and Grasslands
EvoLand also tackled biomass beyond forests. For croplands and grasslands, the project developed models of Gross Primary Productivity (GPP) at 10-metre resolution. By recalibrating the Light Use Efficiency (LUE) factor specifically for these land cover types, adjusting the temperature stress factor and including a drought stress factor based on volumetric soil water content they achieved more accurate estimates of agricultural productivity than current available global models. The model is callibrated and validated using the GPP data measured in the ICOS network. In the snapshot below the improved model is visualized besides the current available 300m GPP product from Copernicus. It is visible that the prototype shows much more spatial variability allowing to distinguish (within) field GPP variability. This opens the door to better monitoring of food security, crop yields, and carbon uptake in agricultural systems.
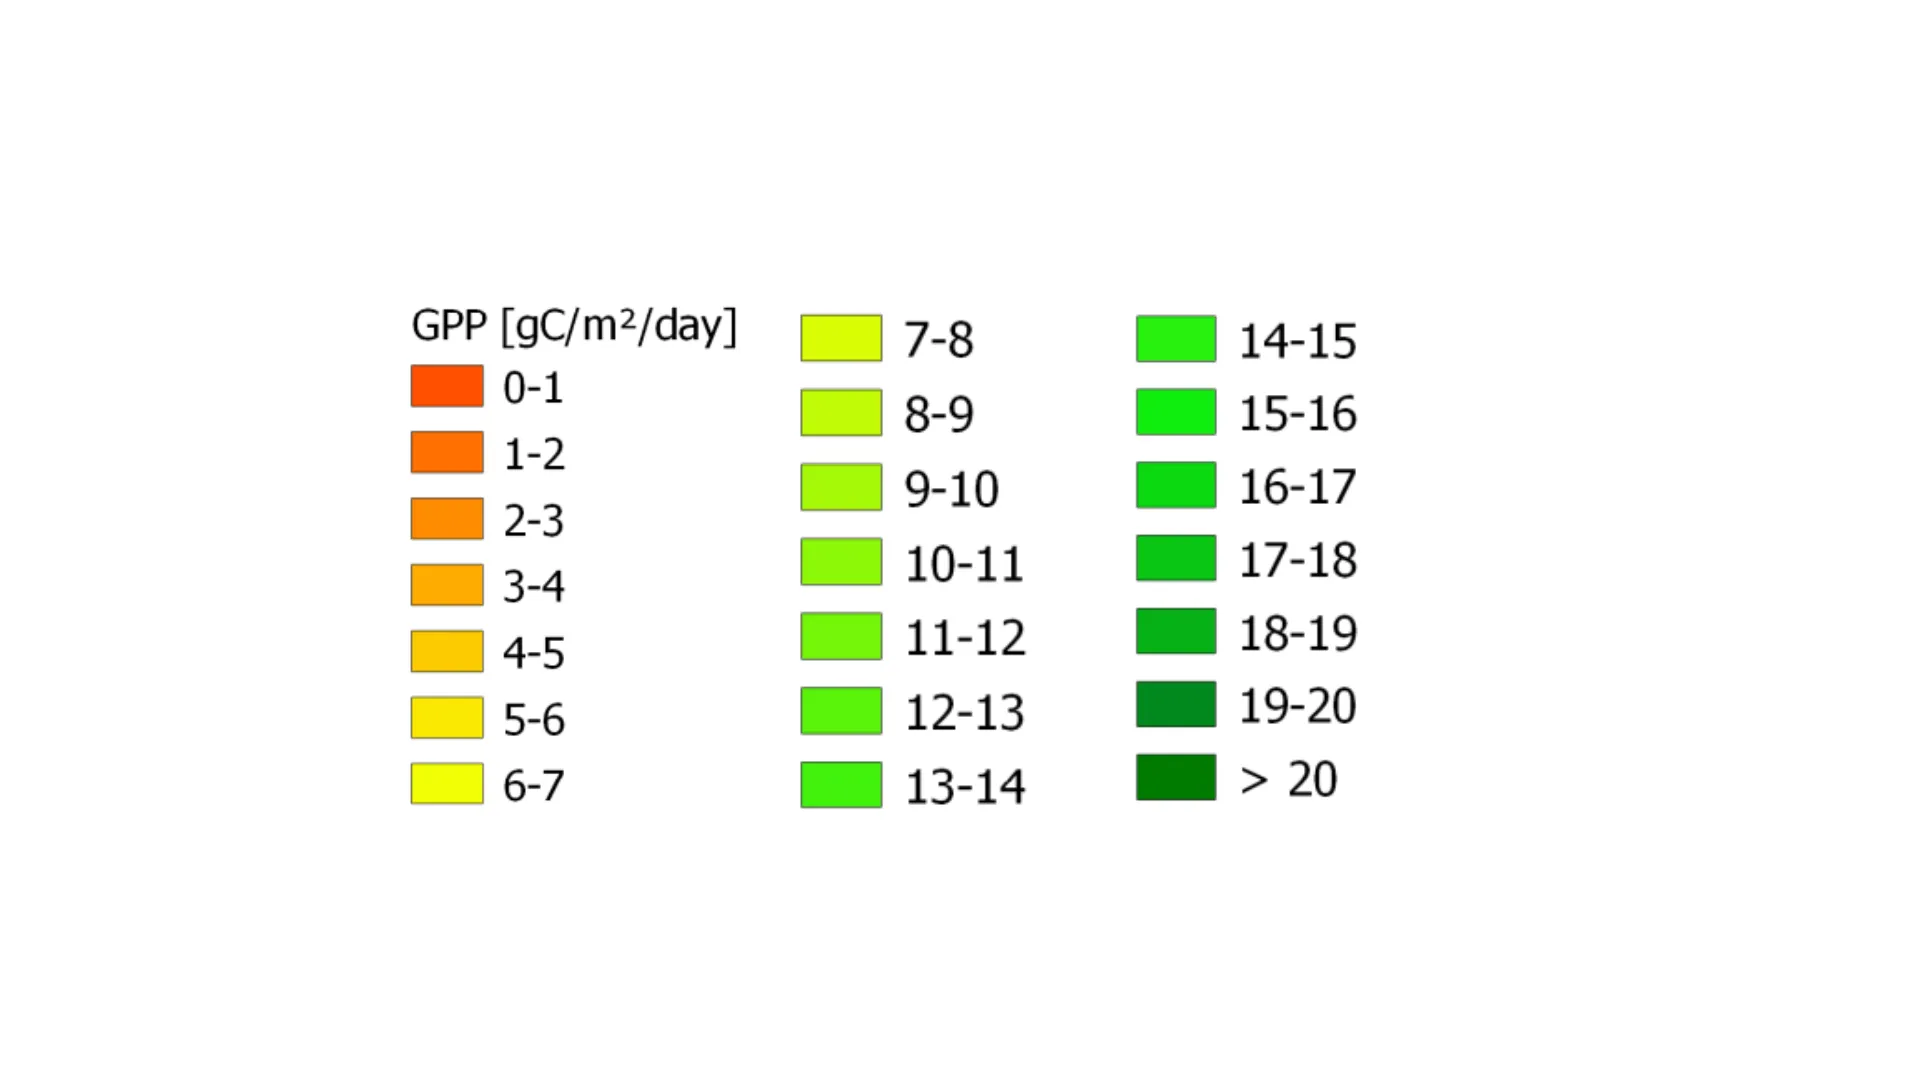
Left: 300m GPP from the CGLM and right 10 m GPP prototype developed within EvoLand
Together, these innovations transform biomass mapping into an operationally relevant tool for both science and policy. They allow Europe to better account for its carbon stocks, support sustainable forest management, and improve monitoring of cropland and grassland productivity. In the context of EU climate strategy, where accurate carbon accounting is essential, EvoLand’s work provides a crucial piece of the puzzle.
Newsletter
Stay current! Subscribe to our EvoLand newsletter!